
As promised last week I'm going to share some stats about the draw at Chester which kicks off it's three day meeting today and which is on Channel Four.
We talked previously about draw biases not just effecting sprint races and about it being more about going around the bend.
Chester is all about the bend with the course being virtually a circle!
As we'll see in a minute the bias is all about the starting position in relation to the bend.
So here are the stats for the last 11 years for each starting stall.
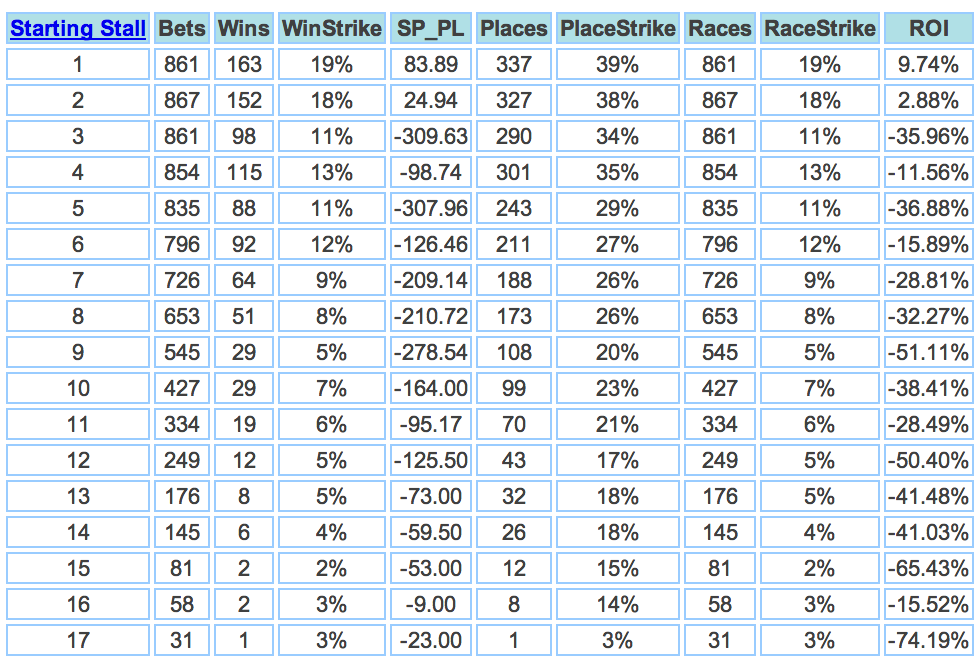
What we see here is that the strike rate for Stall 1 is 19% and for Stall 2 is 18% the strike rate gradually decreases as the stall numbers increase, dropping as low as 2% albeit for lower numbers of runs.
Over the long term you can just back all Stall 1 and Stall 2 runners and make a profit at SP, the last four years have all been profitable.
The next table looks at Race Distance. (Stalls 1 & 2)


Here we can see that the strike rate is highest at 5 furlongs, 5 1/2 furlongs and 6 furlongs.
But also at 1 mile 3 1/2 furlongs and 1 mile 4 1/2 furlongs.
Lets look at why that might be, with a look at the course layout.
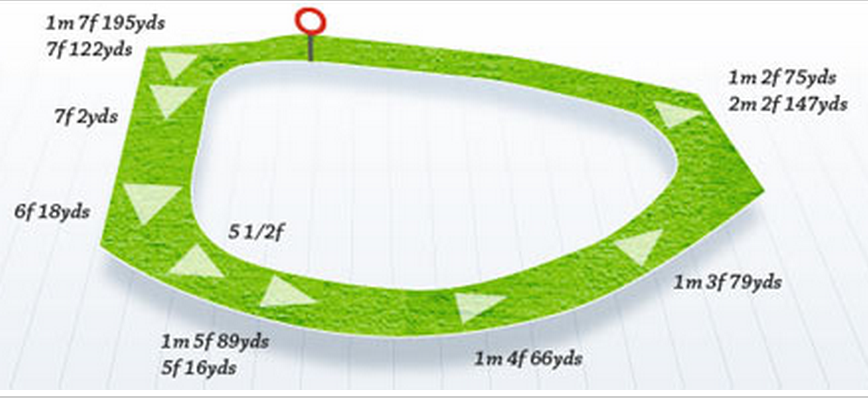
What we can see here is that the 6 furlong start is right before a bend, the 5 furlong start is on the bend as is the 1 mile 4 furlong and the 1 mile 3 furlong.
All other distance start on the straight.
It's also worth noting that the 5 furlong races are not as profitable (ROI) as the others with the high strike rate and that will be because the Chester draw bias is well known and because most punters assume that it will be most effective at the sprint distance and so they over bet the low stalls in those races.
Today's Selection
Chester 3.15 Top Boy – eachway bet – 8/1 Paddy Power, Bet 365, Bet Victor
Image credits Horse Race Base, Racing Post
I love your stuff on the draw another corker you done here geezer,your tables are second to none and you explain easily so us thickos can understand nice one pal regards legsdiamond
the draw factor at Chester is very interesting…
Are there any other tracks with a similar win effect? if there are can you write and tell me which ones…Thanks Graham